Did 2014 Borrow Performance from 2015?
January 13, 2015
6:50pm CST
Very good question to ask here. Did 2014 borrow performance from 2015? From my point of view I believe the answer is yes.
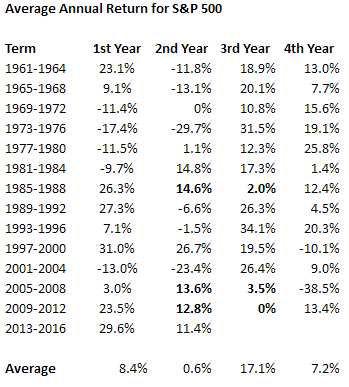
When I first started my market studies in the late 1990’s I learned the basics of cycles and seasonality. The January Barometer, sell in May and go away come back after Labor Day, etc. When it comes to the Presidential Cycle on a historic basis the strongest years (in order) are the 3rd year, 4th year, 1st year, and then the worst is normally the 2nd year (see data below).
Many investors came into 2015 bullish because its the 3rd year of the Presidential Cycle. Let me be the first to say that relying upon the Presidential Cycle to be accurate has been horrible since 2006. Prior to that it actually worked pretty well. I’m not sure exactly why it hasn’t acted as it has in the past but if you look below you can see what I am talkikng about here. 2006 should have been a weak/down year. It was up double digits. The normally strong 3rd and 4th years that followed were horrible. Then we have the first two years of the next cycle (2009-2010). Both were solid up years. Then came the supposedly strong 3rd year in 2011 and it ended flat. 2012 ended up double digits which was in line with normal historical precendents. 2013 was another first year that historically should have been weak but was a barn burner. 2014 was a second year and it was supposed to be weak but ended the year up 11.4%
Since 2006 the script has actually flipped. Strongest to weakest have been the 1st year, 2nd year, 3rd year, and 4th year. 4th year would move into third if one considers 2008 to be an outlier. Completely backwards of the way it has traditionally worked dating back to 1960.
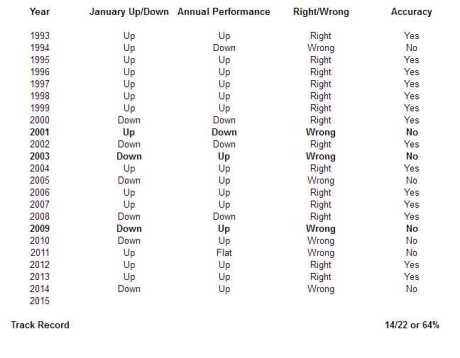
When looking at 2014 I want to clarify what I mean when I say it was “supposed to be” down”. This is based on the Presidential Cycle (2014 was a second year which is historically the worst performing and still is by far even after 3 straight performances of positive double digit returns) and the January Barometer. The January Barometer is known as “so goes January, so goes the year”. January was down last year. Yet the market finished up. A lot of this seasonality was why I anticipated a much larger correction in 2014 which would have set the market up for a stronger 2015/2016. On top of it 2014 was supposed to be a 4 year cycle low. However, by having these stronger than normal 2nd years it is my view that the lows that are supposed to occur in the 2nd year are instead coming in the 3rd or 4th years as seen in 1987, 2007/2008, and 2011.
Below is a graphic of the January Barometer and its accuracy. Since 1993 it has been correct 14/22 years for ~64%. Bolded were the times that it was wrong due to key trend changes. In 2001 the bear market was till in its early stages. 2003 marked the first secular bear market low. Then 2009 marked the next bear market low.
I have discussed this in the past but its time to bring it up again. Note that almost every 3rd year is up double digits. Look at the ones that weren’t. They were 1987, 2007, and 2011 (all bolded). What did every one of those have in common? Every single one of those instances saw a stronger than normal second year return which in turn pulled performance from the normally strong 3rd year. Since 2014 was much stronger than anticipated I think there is a very good chance that we may see a third consecutive 3rd year that is weaker than expected.
A while back I ran across this piece from Sy Harding discussing the presidential cycle and found his observations quite interesting.
His observation is that these weak 3rd/4th years normally come with second term presidents. This actually makes a lot of sense. Instead of going through a normal corrective phase in the 1st or 2nd year of the cycle, these presidents are trying to keep the economy strong all the way through. Once they get to the third year of their second term the bull market is generally long in the tooth. Therefore continuing to find ways to goose both the economy and stock market higher become much more difficult. I had never thought of it that way but it lines up with my own work and it makes a lot of sense.
Coming into this year my anticipation was that the market would be up into April. After that it would run into trouble over the summer. In particular from May-July. I have 9 month cycles hitting in April and July this year and on top of it “sell in May and go away” hasn’t worked since 2011. After being wrong/not working well 3 years in a row it seems to me that it is overdue to work here in 2015.
My view wasn’t just built on these seasonalities though. The market seemingly had every chance in the world to really fall apart last September/October and yet the S&P 500 only fell 9.8%. In large caps this only corrected the move from the June 2013 lows. In small caps they saw much more damage but still only corrected ~62% of the rally from the June 2013 lows and 38% of rally from the November 20123 lows. Following both the October and December bottoms there were breadth thrusts to the upside which indicated more upside to come. More importantly when all of the major indexes hit new highs going into the end of the year the cumulative advance/decline lines confirmed in every index aside from the Nasdaq Composite. From past experience the cumulative advance/decline line on the Nasdaq Composite hasn’t tended to work very well so I wasn’t too concerned. There was also a surge of new 52 week highs at the end of the year to confrirm the new highs. On top of it semiconductors and financials were leading the charge higher which is a key ingredient in a healthy bull market. Lastly, small cap stocks broke out of a year long range to the upside at the end of the year which makes 2014 simply look like a year of consolidation prior to the next leg higher.
The biggest risks coming into 2015 with regard to my view of a higher market into April and weakness over the summer (likely similar to 2011) were sentiment, valuation, the continued weakness in oil, and continued strength in U.S. Treasuries (particularly 10 and 30 year).
Sentiment got way too bullish in the second half of December as measured by multiple indicators (Investor’s Intelligence, AAII, NAAIM, and dumb money on http://www.sentimentrader.com which hit a new all-time high. According to one source the last two weeks of December saw the highest weekly inflows into index weighted mutual funds/ETF’s since the data has been tracked by Lipper.
With regard to valuation I would just be re-hashing things I have already gone over before. See my prior posts from September on the subject. My view was that the market could remain irrational for a long period of time. I still don’t believe we have seen the true greed phase of this bull market unless it was the first 3 months of 2014. Q1 2014 in biotech, marijuana, the cloud, etc. was somewhat reminiscent of 1999-2000. It would just seem that 3 months is too short to consider it the greed phase of the bull market.
The continued weakness in oil leads to margin calls, selling begets more selling, that portion (energy) of the indexes posting earnings aren’t that great, and then on top of it there is the argument over whether the weakness in price is over-supply or just weak demand. I think we are seeing a bit of both. Outside of the US I think the biggest problem is definitely weaker demand.
With regard to Treasuries I have to say I’m quite surprised at how strong they have been so far this year. This isn’t good for equities from two points of view. If money is flowing into Treasuries it is likely because of concerns regarding future economic growth. From another standpoint any money going into the Treasury market is capital that isn’t going into the equity market.
So in closing I do think that 2014 stole performance from what many were expecting to be a strong 3rd year for stocks in 2015. In some way I think this will turn out similar to 1986-1987, 2006-2007, or 2010-2011. My initial view was that the market would go up into April and then run into trouble over the summer as described above. So maybe up to ~2200 on the S&P 500 followed by a decline to 1700-1800 followed by a rally for the rest of the year that would somewhat make up for the summer losses.
Based on some observations to begin the year I’m getting a bit concerned about the way the market is acting right now. Very unusual activity for January but I will touch on this in another post.

