The Only Chart that Matters (Again)
January 28, 2015
8:10pm CST
Time to re-visit the market performance relative to the size of the Fed Balance Sheet.
Fast forward 7 months and what do we have?
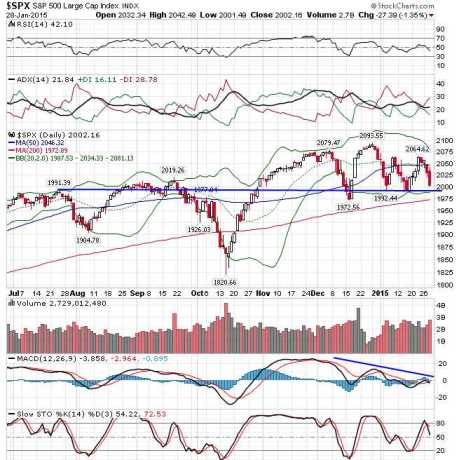
Treasuries and bonds have been soaring. Commodities have been decimated. Stocks have gone nowhere. The S&P 500 hit a peak of 1991 back in July 2014. Today it closed at 2002. Through all the gyrations of the past 7 months the market has gone absolutely nowhere. Keep in mind that the Fed Balance Sheet leveled out in October 2014 (not shown in the chart from 6/28/14). In that context it shouldn’t be that shocking. What was really shocking (at least to me) was how modest the correction into October ended up being. Then on top of it the magnitude of the ensuing rally that lasted all the way into the end of 2014. My previous expectation (based on the Fed balance sheet, internal deterioration, and my 9 month cycles) was that the market would see a peak in July and a bottom in October. Size of the correction I was anticipating was 10-25%. When it was all said and done it was a shade under 10%.
Is the market falling vicitim to a flattening of the Fed balance sheet again? Each time the Fed tried to pull out of QE back in 2010 and 2011 the equity market anticipated it months in advance. The result was increased volatlity and market corrections of 10-20%. Somehow this time was different. The S&P 500 continued to make new highs into the end of 2014 but since the calendar flipped to 2015 the market has just been an absolute mess. The first two trading days of the year were a huge warning.
Is this just a delayed reaction to the Fed ending QE in October 2014? Sure seems like that is the case at the moment. In this light, the Presidential Election Cycle study that I posted earlier this month suggesting that 2014 likely took performance from 2015 makes a lot of sense. Will this be 3 in a row? 2006-2007, 2010-2011, 2014-2015? Sure is looking like it.
Importance of the 34 Year Cycle
January 28, 2015
5:55am CST
I have mentioned the 34 year cycle here and there in recent years but since we are coming into a key timeframe (2014-2017) I believe it is time to elaborate.
Why the number 34? Good question. It is a fibonacci number and its also the approximate length of a typical interest rate cycle. For instance the 30 year bond yield bottomed in 1949 around 2.2% and it happened to peak in 1981 at over 14%. Coincidentally the stock market put in a major low in 1949 and another major low in 1982. Awfully close to the same dates I just gave on the yield of the 30 year bond.
Its also important to be clear that one has to be flexible as the number of years won’t always be exactly 34. A bit like there being more sunlight during the day in the summer and less sunlight during the day in the winter. From my observation the cycle can be anywhere from 32-35 years. Considering that the equity market put in a major low in 1982 (which began the epic secular bull market that lasted until 2000) if one looks forward 32-35 years that takes us to 2014-2017. Since the market has been rising since March 2009 and we are near the higher end of the valuation spectrum I tend to lean towards a market peak in 2015-2016. It just seems a lot more logical at this point to see a major peak in stocks in this 32-35 year cycle as opposed to a bottom. To say this bull market (from 2009) is long in the tooth would be an understatement and from a cycle perspective there are some reasons to believe that the market will see its secular bear market (from 2000) valuation low in 2017-2018.
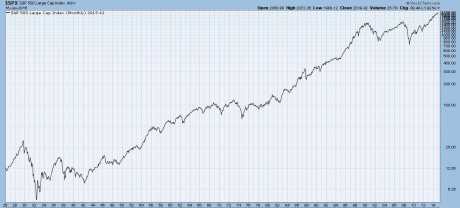
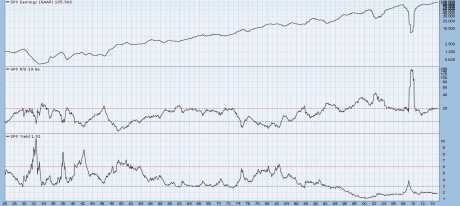
Why 2017-2018 for a bear market low? Let me first be clear that historically speaking secular bear markets have had two lows. Their nominal (price) lows and then their valuation lows. See the chart below and follow along with me.
There have been 3 secular bear markets since 1920. The first two lasted 16 and 20 years. Current is to be determined. Prior secular bears would be 1929-1949, 1966-1982, and 2000-present. During those periods of time the market has difficulty making upside progress as it works out the excesses of the preceding secular bull market.
A secular bear market period is defined from the final market peak to the final valuation low (low P/E and high dividend yield) before the market goes on to make new highs.
1929-1949- The market absolutely cratered into 1932 and that represented the nominal (price) low of this secular bear. After this the market began to move higher but it didn’t put in the final valuation low and really begin to take off until 1949. The peak of 1929 wasn’t taken out for good (as in above it, never going back below it) until 1954.
Valuation lows occurred in 1938, 1942, and 1949.
1966-1982- After a huge run from 1932-1966 (34 years….) the market once again went nowhere for the next 16 years. The Dow peaked around 1000 in 1966 and didn’t take the 1000 level out for good until 1982. During this cycle the nominal low came in 1974 and the valuation low came in 1982.
2000-Present- Maybe I’m crazy but I just don’t buy into the fact that everything is rosy and that the entire secular bear was over in less than 13 years. I have a hard time believing that the S&P 500 is never going back below its 2000 and 2007 peaks of 1554 and 1576. Even if I assume that the nominal low came in 2002-2003 its hard for me to see 2009 or 2011 as the valuation low. At prior secular bear market valuation lows P/E’s were in the single digits and dividend yields were above 6%. We came nowhere close to that in 2009 or 2011. See the chart above.
Note that in the prior 2 secular bear markets the valuation low had a tendency to come ~8-10 years after the nominal low. Nominal low 1932, valuation low 1942 (10 years). The nominal low for the second secular bear came at the halfway mark in 1974 (1966-1982). Then the valuation low came 8 years later.
8-10 years from the 2009 low would be 2017-2019. 2017-2018 just so happens to be the first and second years of the Presidential Cycle (discussed in my previous post). So if the cycle is going to begin its reversion to the mean the next two first and second years aren’t likely to be as good as the last two.
Also note that if this bear market is similar to 1966-1982 and the nominal low came at the halfway point that would imply 2009 as the nominal low and would peg the final valuation low as 2018.
So on to examples of the 34 year cycle at work.
1896-1929- Major low to major peak (33 years)
1907-1942- Major low to major low (35 years)
1932-1966- Nominal bear low to secular bull market peak.
1942-1974- Major valuation low for 1929-1949 secular bear to nominal low of the next secular bear in 1974.
1949-1982- Final valuation low of the 1929-1942 secular bear to the valuation low and end of the 1966-1982 secular bear.
1966-2000- Secular bull market peak (1932-1966) to the next secular bull peak (1966-2000).
1974-2007/2008- Nominal low of secular bear market to major peak/crash.
1982-(2014-2017)- ???
1987- (2019-2022)- ???
Right now I’m of the belief that this current 34 year cycle is much more likely to be a peak as oppoed to a bottom. If the market had been going down for the past two years and valuations were more reasonable I would say the opposite.
Keep in mind that I am just trying to put the cycle into perspective. This doesn’t mean that the market falls apart tomrorrow. Its possible that the market could go up into 2016 and then fall into 2017-2018. This 34 year cycle is obviously no coincidence so keep in mind that from the major low in 1982 we are currently in the very important window of 2014-2017.


